https://blog.csdn.net/qq_44168575/article/details/97192690
С�˼�ѧϰC#һ�����ڵ��ĵ� ��ѧУ������Ҫ��Сѧ���ڼ仨�˼���ѧ��һ��C#����Ϊû���˴�����Ұ�������֣����������ڵ���ƷҲ�в��ٵ�Bug,��Ӧ��һ�´��ʲô�Ļ��ǿ��Եģ��ѻ�����˵���Ƚ����ҵĴ�Ů������Щʲô����
 ��������Ϊ�������֣��������ú����ݽ��ա�������ʾ����������ݴ洢 ��������Ϊ�������֣��������ú����ݽ��ա�������ʾ����������ݴ洢 1���������ݽ��գ�ֻ��ģ����������ת���� 2���������ݲ�����ʾ 3���������ݵĴ洢��excel�� 1.1 ���ݽ��� �ⲿ����Ҫ�������£����ô��ڡ����ݽ���
�ⲿ����Լ��������һ��ֻ�ǵ������õ��ɼ������ݣ������н���ת��ʲô�ģ��������form1���������serialport1�ؼ���ѡ�����������������ҵ�һ����ɫ������ͼ�꣬������������һ��datareceived��������λ���form1.cs�ļ��в���һ������ 1.2���ڽ����¼����� private void serialPort1_DataReceived(object sender, System.IO.Ports.SerialDataReceivedEventArgs e) { date = serialPort1.ReadExisting(); list_1.Add(date); textBox2.AppendText(date + "\r\n"); }
ͬʱ��form1.designer.cs�ļ��л����һ���¼�������������Ҫ����form_load��˫��form1���ڲ����ĺ����������� private void Form1_Load(object sender, EventArgs e) { this.serialPort1.DataReceived += new System.IO.Ports.SerialDataReceivedEventHandler(this.serialPort1_DataReceived); }
�����Ҫ���ô��ڣ�������ֻ�����˴��ںźͲ����ʣ��������Ҫ�����Լ�������������Ҫ�� 1.3���ü����� private void button1_Click(object sender, EventArgs e) { try { if (comboBox1.Text != "" | comboBox2.Text != "") { serialPort1.PortName = comboBox1.Text; serialPort1.BaudRate = Convert.ToInt32(comboBox2.Text); serialPort1.Open(); button1.Enabled = false; button2.Enabled = true; } } catch { MessageBox.Show("�����ö˿ڣ�����"); } }
- 1
- 2
- 3
- 4
- 5
- 6
- 7
- 8
- 9
- 10
- 11
- 12
- 13
- 14
- 15
- 16
- 17
- 18
1.4 �رմ��� private void button2_Click(object sender, EventArgs e) { if (serialPort1.IsOpen) { serialPort1.Close(); button1.Enabled = true; button2.Enabled = false; } }
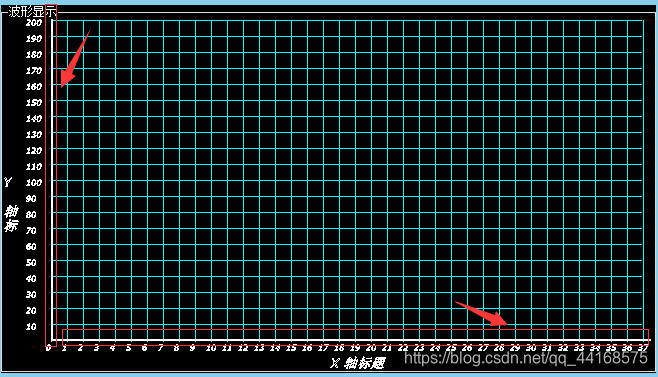
���ˣ������ⲿ�ֵĹ������������� 2.1������ʾ �ⲿ��������Ҫ��Ϊ�������֣����������ꡢ������
�ⲿ����������߲�̫�������һ��������Ƚ϶࣬�漰�Ĺ�ʽҲ�϶࣬�͵�һ���Կ�ʹ����ʵ������ܹ��������������DZȽϼģ���Ҫ��˼����� �� �ҵ�+ƽ�� 2.2 ������ private void groupBox3_Paint(object sender, PaintEventArgs e) { for (int i = 0; i <= max_x / gap_x + 1; i++) { e.Graphics.DrawLine(TablePen, StartPrint_x+d + i * gap_x, StartPrint_y, StartPrint_x+d+ i * gap_x, max_y + 6); } for (int i = 0; i <= (max_y - 10) / gap_y; i++) { e.Graphics.DrawLine(TablePen, StartPrint_x+d, StartPrint_y + i * gap_y, StartPrint_x+d + max_x, StartPrint_y + i * gap_y); } }
- 1
- 2
- 3
- 4
- 5
- 6
- 7
- 8
- 9
- 10
- 11
- 12
���źܶ��˿�����δ���ֱ���Զ����������˰ɣ�����������ʵ��һ�������� e.Graphics.DrawLine(pen, x1, y1, x2, y2);
��˼�ǣ�����һ֧���� pen �ıʣ��ӵ㣨x1,y1�������㣨x2,y2��������м�����������ƪ�������ﲻ����(�ҵ�+ƽ��)��Դ�ļ����У�����ע�ͣ�����ҿ��Կ��� 2.3���������� ���������˼����������������һЩ�����ߵĴ��루��ĩ�����ӣ���������£�����������һ��������İ취���� �� | �� �� �� �� �� ͨ�� for ѭ������������ͨ���ַ�����ʽ��ӡ�ں��ʵ�λ���ϣ�������Ҫ�����Լ������������������������������� low �����ܺ��ã���������ʲô�ķ��������Ǹ��ҽ�һ�°�
��δ��뿴����Ҳ���Ǻ��Ѻã���ʵҲ��һ�������� gp.AddString(string, pen, font_style, font_size, text_form(x, y, width, height), null);
��˼�ǣ�����һ֧���� pen �ıʣ����Ĵ�ϸΪ font_size ,������ text_form ���ı�����д�·��Ϊ font_style �� string �ַ�������ı���ĸ�Ϊ height,��Ϊ width ,�ı�������ϵ�����Ϊ�� x , y ��
��Ҫ��һ�㣬�����Ǹ���������������������һͬʹ�ã������ַ�����Ч e.Graphics.DrawPath(Pens.White, gp);
private void groupBox3_Paint(object sender, PaintEventArgs e) { string axis_x = "��"; string axis_y = "|"; for (int i = 0; i < 75; i++) { gp.AddString(axis_x, family, fontstyle, 8, new RectangleF(StartPrint_x + d + i * gap_x/2 - 2, StartPrint_y + max_y - 16, 400, 50), null); } for (int i = 0; i < 40; i++) { gp.AddString(axis_y, family, fontstyle, 8, new RectangleF(47, i * gap_y/2 + 12, 400, 50), null); } e.Graphics.DrawPath(Pens.White, gp); }
- 1
- 2
- 3
- 4
- 5
- 6
- 7
- 8
- 9
- 10
- 11
- 12
- 13
- 14
- 15
2.4��ǿ̶ȼ���ͷ ��ʵ��������潲�Ļ�����������ԭ����һ���ģ���Ҫ�漰 gp.AddString������ e.Graphics.DrawPath( )�����������ٽ�����ͨ�� for ѭ�����ں��ʵ�λ�þͺ��� private void groupBox3_Paint(object sender, PaintEventArgs e) { for (int i = 0; i <= max_x / gap_x + 1; i++) { gp.AddString((i).ToString(), family, fontstyle, 8, new RectangleF(StartPrint_x+d + i * gap_x - 7, StartPrint_y+max_y-8, 400, 50), null); } for (int i = 0; i <max_y/gap_y; i++) { string Str_y = Convert.ToString((20 - i) * (Max-Min)/20); if (i == 0) Str_y = Max.ToString(); if (i == 20) break; gp.AddString(Str_y, family, fontstyle, 8, new RectangleF(23, i * gap_y+12, 400, 50), null); } gp.AddString(textBox11.Text, family, fontstyle, 12, new RectangleF(groupBox3.ClientRectangle.Width / 2, StartPrint_y + max_y+5, 400, 50), null); gp.AddString(textBox12.Text, family, fontstyle, 12, new RectangleF(0, groupBox3.ClientRectangle.Height / 2 - StartPrint_y, 10, 50), null); e.Graphics.DrawPath(Pens.White, gp); }
- 1
- 2
- 3
- 4
- 5
- 6
- 7
- 8
- 9
- 10
- 11
- 12
- 13
- 14
- 15
- 16
- 17
- 18
- 19
2.5������ͼ ���������������ʾ���Խ����ݷ�Ϊ�ĸ���Χ��ÿ����Χ�ò�ͬ����ɫ���ƣ�����ڴ��������ĸ���Χ���жϣ������漰�ĺ����ͻ�����ĵط���һ���� private void serialPort1_DataReceived(object sender, System.IO.Ports.SerialDataReceivedEventArgs e) { if (dstr2 <= Up_a && dstr2 > Dw_a) { graphics.DrawLine(LinesPen_a, Origin_x + i * gap_x+d, dstr1, Origin_x + (i + 0.1f) * gap_x+d, (int)(Origin_y - dstr2 / div)); } i += step; dstr1 =(int)( Origin_y - dstr2 /div); Delay(time); }
3.1ѡ��洢·�� private void button18_Click(object sender, EventArgs e) { openFileDialog1.Filter = "excel�ļ�|*.xls"; if(openFileDialog1.ShowDialog()==DialogResult.OK) { textBox14.Text = openFileDialog1.FileName; } }
3.2���������������� ����Ҫ����һ���ռ���,����ķ����������������������ǣ� using Microsoft.Office.Interop.Excel;
private void button19_Click(object sender, EventArgs e) { Microsoft.Office.Interop.Excel.Application excel = new Microsoft.Office.Interop.Excel.Application(); object missing = System.Reflection.Missing.Value; Workbook workbook = excel.Application.Workbooks.Open(textBox14.Text, missing, missing, missing, missing, missing, missing, missing, missing, missing, missing, missing, missing, missing, missing); Worksheet newWorksheet = (Worksheet)workbook.Worksheets.Add(missing, missing, missing, missing); excel.Application.DisplayAlerts = false; workbook.Save(); workbook.Close(false, missing, missing); }
- 1
- 2
- 3
- 4
- 5
- 6
- 7
- 8
- 9
- 10
- 11
- 12
3.3�����
������˼���� excel �ĵ� 1 �е� 2 newWorksheet.Cells[1, 1] = "chen";
4.1��ͼ ����һ�������ĺ����� private void button6_Click(object sender, EventArgs e) { System.Drawing.Point p = groupBox3.PointToScreen(new System.Drawing.Point(0, 0)); Bitmap bit = new Bitmap(this.Width, this.Height); Graphics g = Graphics.FromImage(bit); g.CompositingQuality = CompositingQuality.HighQuality; g.CopyFromScreen(p.X, p.Y, 0, 0, new Size(groupBox3.Width, groupBox3.Height)); number += 1; bit.Save("״̬" + number.ToString() + ".png"); }
[1]: https://www.cnblogs.com/liuxianan/archive/2012/07/29/2613755.html ��ͼ�ο�
[2]: https://blog.csdn.net/lickilygou/article/details/85102538 �������òο� C#����ͨ�ż����ݱ���洢 ���ò����о����õ��������ݵ��Զ�����¼�������ɴ��ڲɼ������excel�й��ܾͱ�÷dz�ʵ�ã��������ʵ�ַ�������ϵļ�����dataGridView�ؼ���SaveFileDialog�����ڵ��Բ�һ������װ��office��ֱ��ʹ��office�������ȱ��һ����ͨ���ԣ���˱�ʵ�����ô洢Ϊcsv��ʽ���������ļ���Ȼ��������õĸ�ʽת��ΪEXCEL�ļ����ɡ�
|