Python ��ȡ��������,��̬��ͼ��ʾ�� ���������Ҫ�ѵ�Ƭ����ȡ�Ĵ�������ѹ����ʵʱ��PC��ͨ��������ʾ�������պ��ڿ�python, ����������python ��uart�˿�ͨѶ������ͨ��matplotlib.pyplot ģ��ʵʱ����ͼ�γ����� 1. �ϻ���˵����ͼ 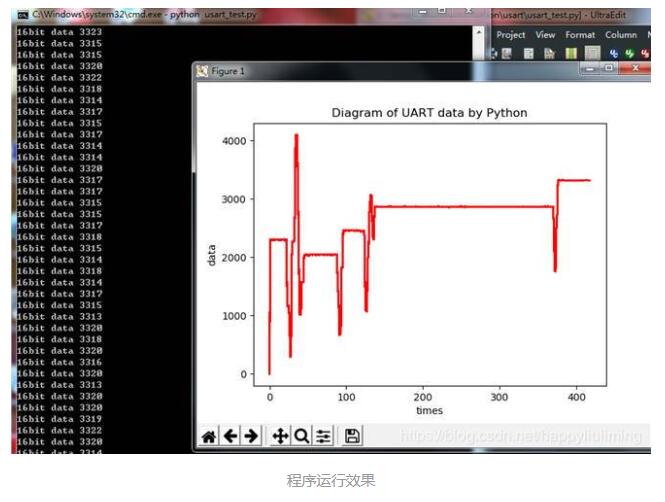 ��Ϊû��UI������ʱ��Ҫ����ʾ�������봮����ز�����com�˿ڣ�������... 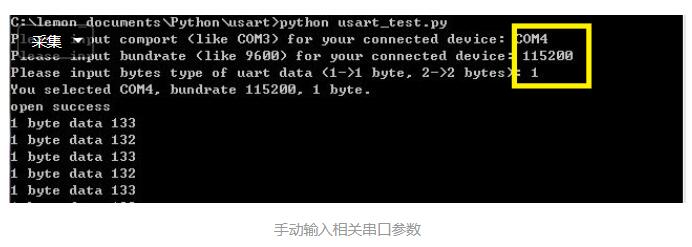 �������£� | 1 2 3 4 5 6 7 8 9 10 11 12 13 14 15 16 17 18 19 20 21 22 23 24 25 26 27 28 29 30 31 32 33 34 35 36 37 38 39 40 41 42 43 44 45 46 47 48 49 50 51 52 53 54 55 56 57 58 59 | import serial import matplotlib.pyplot as plt import numpy as np import time import re comport = input('Please input comport (like COM3) for your connected device: ') baudrate = input('Please input baudrate (like 9600) for your connected device: ') bytes = input('Please input bytes type of uart data (1->1 byte, 2->2 bytes): ') bytes = int(bytes) print('You selected %s, baudrate %d, %d byte.' % (comport, int(baudrate), bytes)) serialport = serial.Serial(comport, int(baudrate), timeout=1, parity=serial.PARITY_EVEN, rtscts=1) if serialport.isOpen(): print("open success") else: print("open failed") plt.grid(True) plt.ion() plt.figure(1) plt.xlabel('times') plt.ylabel('data') plt.title('Diagram of UART data by Python') t = [0] m = [0] i = 0 intdata = 0 data = '' count = 0 while True: if i > 300: t = [0] m = [0] i = 0 plt.cla() count = serialport.inWaiting() if count > 0 : if (bytes == 1): data = serialport.read(1) elif (bytes == 2): data = serialport.read(2) if data !='': intdata = int.from_bytes(data, byteorder='big', signed = False) print('%d byte data %d' % (bytes, intdata)) i = i+1 t.append(i) m.append(intdata) plt.plot(t, m, '-r') plt.draw() plt.pause(0.002) | Ŀǰ���ܱȽϼ����Ƿ���һ�����⣬����Ƭ���ͳ������ٶȺܿ�ʱ�� python plot ��ͼ�����Կ��١� Ϊ��������⣬�Ѿ���C# �������˸�winform UI, ʹ��chart�ؼ�����ͼ�� ������ƪPython ��ȡ��������,��̬��ͼ��ʾ������С���������ҵ�ȫ�������ˣ�ϣ���ܸ����һ���ο���Ҳϣ����Ҷ��֧�ֽű�֮�ҡ�
|